• retagged by
1,044 views
0 0 votes

$\textbf{Directions (68 - 72) : }$ Study the following pie-chart and table carefully to answer the questions given below :

The following pie-chart shows the distribution of monthly budget of a person.
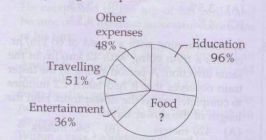
The following table shows the further distribution (in percent) of the above-mentioned items among the five family members i.e. P (the person himself), W (his wife), Rahul (son), Rohit (son), and Preeti (his daughter). His monthly family budget is $\text{Rs. 1,20,000}$.


$\begin{array}{|c|c|c|c|c|c|} \hline \text{Family member} & \text{Education} & \text{Food} & \text{Entertainment} & \text{Travelling} &\text{Other Expenses} \\\hline \text{P} & 10 & 30 & 10 & 40 & 20 \\\hline \text{W} & 15 & 25 & 30 & 10 & 25 \\\hline \text{Rahul} & 40 & 20 & 20 & 25 & 20 \\\hline \text{Rohit} & 25 & 15 & 25 & 10 & 10 \\\hline \text{Preeti} & 10 & 10 & 15 & 15 & 25 \\\hline \end{array}$


The average expenses of Rohit is approximately what percent of the average expenses of $\text{W (Wife)}$ ?

  1. $79.4 \%$
  2. $85.3 \%$
  3. $79.8 \%$
  4. $83.5 \%$

Please log in or register to answer this question.

Position:
Show:

Related questions

0 0 votes
0 0 answers
1.3k
1.3k views
Lakshman Bhaiya asked Jul 22, 2022
1,281 views
The question is based on the table given below which represents the percentage growth in the volume of sales of five brands of motor cars across the years mentioned and t...
0 0 votes
0 0 answers
1.3k
1.3k views
Lakshman Bhaiya asked Jul 22, 2022
1,288 views
The question is based on the table given below which represents the percentage growth in the volume of sales of five brands of motor cars across the years mentioned and t...
0 0 votes
0 0 answers
1.4k
1.4k views
Lakshman Bhaiya asked Jul 22, 2022
1,360 views
The question is based on the table given below which represents the percentage growth in the volume of sales of five brands of motor cars across the years mentioned and ...
0 0 votes
0 0 answers
1.2k
1.2k views
Lakshman Bhaiya asked Jul 22, 2022
1,190 views
The question is based on the table given below which represents the percentage growth in the volume of sales of five brands of motor cars across the years mentioned and t...
0 0 votes
0 0 answers
1.4k
1.4k views
Lakshman Bhaiya asked Jul 21, 2022
1,420 views
In an examination $\text{A}$ got $25 \%$ marks more than $\text{B, B}$ got $20 \%$ marks less than $\text{C}$ and $\text{C}$ got $10 \%$ more than $\text{D.}$ If $\text{D...