1,113 views
0 0 votes

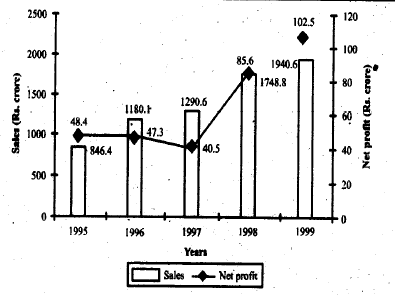
Note: Net profit= Gross profit - Tax. Gross profit = Sales - Expenses. The figures for sales is given at the bottom of the bar chart and the figures for net profit is given on top of the line chart.

If XPL sold $20,000$ units in both $1998$ and $1999,$ by what percentage has the price per unit changed?

  1. $8.7\%$
  2. $10.96\%$
  3. $9.86\%$
  4. Cannot be determined.

Please log in or register to answer this question.

Position:
Show:

Related questions

1 1 vote
0 0 answers
1.1k
1.1k views
Lakshman Bhaiya asked Mar 31, 2022
1,097 views
The following chart gives the production of three major crops (in million tons) across five Indian states in the year $1998.$If these five states constitute $77$ percent ...
0 0 votes
0 0 answers
1.4k
1.4k views
Lakshman Bhaiya asked Mar 31, 2022
1,443 views
The following chart gives the production of three major crops (in million tons) across five Indian states in the year $1998.$If the yield per hectare of sugar is $3.86$ t...
1 1 vote
0 0 answers
1.6k
1.6k views
Lakshman Bhaiya asked Mar 31, 2022
1,648 views
The following chart gives the production of three major crops (in million tons) across five Indian states in the year $1998.$If sugar costs Rs. $700$ per ton and wheat co...
0 0 votes
0 0 answers
1.1k
1.1k views
Lakshman Bhaiya asked Mar 31, 2022
1,124 views
The following chart gives the production of three major crops (in million tons) across five Indian states in the year $1998.$What is the ratio of total wheat production i...
0 0 votes
0 0 answers
1.2k
1.2k views
Lakshman Bhaiya asked Mar 31, 2022
1,193 views
Note: Net profit= Gross profit - Tax. Gross profit = Sales - Expenses. The figures for sales is given at the bottom of the bar chart and the figures for net profit is giv...