The following bar chart gives percentage growth in household incomes of the middle, upper middle and high-income categories in the four regions for the period between $87-88$ to $94-95$.
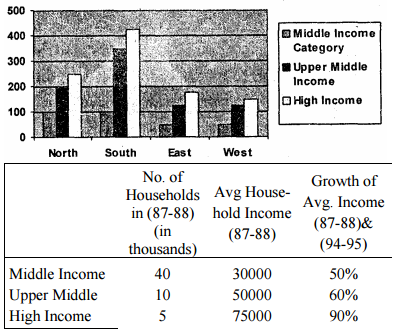
What is the percentage increase in total household income for the Northern Region (upper middle) over the given period?
- $100$
- $200$
- $240$
- Cannot be determined