edited by
1,472 views
0 0 votes

Figure $1$ shows the amount of work distribution, in man-hours, for a software between offshore and onsite activities. Figure $2$ shows the estimated and actual work effort involved in the different offshore activities in the same company during the same period. [Note: Onsite refers to work performed at the customer's premise and offshore refers to work performed at the developer's premise.]
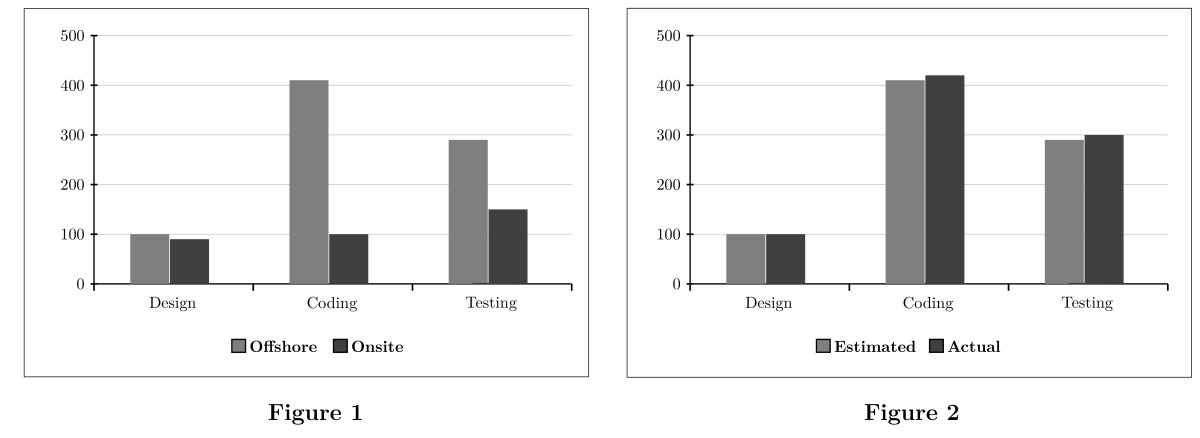
If $50$ percent of the offshore work were to be carried out onsite, with the distribution of effort between the tasks remaining the same, which of the following is true of all work carried out onsite?

  1. The amount of coding done is greater than that of testing
  2. The amount of coding done onsite is less than that of design done onsite
  3. The amount of design carried out onsite is greater than that of testing
  4. The amount of testing carried out offshore is greater than that of total design

Please log in or register to answer this question.

Position:
Show:

Related questions

0 0 votes
0 0 answers
1.5k
1.5k views
go_editor asked Apr 24, 2016
1,531 views
Figure $1$ shows the amount of work distribution, in man-hours, for a software between offshore and onsite activities. Figure $2$ shows the estimated and actual work effo...
0 0 votes
0 0 answers
1.4k
1.4k views
go_editor asked Apr 24, 2016
1,425 views
Figure $1$ shows the amount of work distribution, in man-hours, for a software between offshore and onsite activities. Figure $2$ shows the estimated and actual work effo...
0 0 votes
0 0 answers
1.2k
1.2k views
go_editor asked Apr 24, 2016
1,235 views
Figure $1$ shows the amount of work distribution, in man-hours, for a software between offshore and onsite activities. Figure $2$ shows the estimated and actual work effo...
0 0 votes
1 1 answer
1.7k
1.7k views
go_editor asked Apr 24, 2016
1,723 views
Figure $1$ shows the amount of work distribution, in man-hours, for a software between offshore and onsite activities. Figure $2$ shows the estimated and actual work effo...
1 1 vote
1 1 answer
2.8k
2.8k views
go_editor asked Apr 24, 2016
2,755 views
There are six companies, $1$ through $6.$ All of these companies use six operations, A through F. The following graph shows the distribution of efforts put in by each com...