• edited by
2,778 views
1 1 vote

There are six companies, $1$ through $6.$ All of these companies use six operations, A through F. The following graph shows the distribution of efforts put in by each company in these six operations.
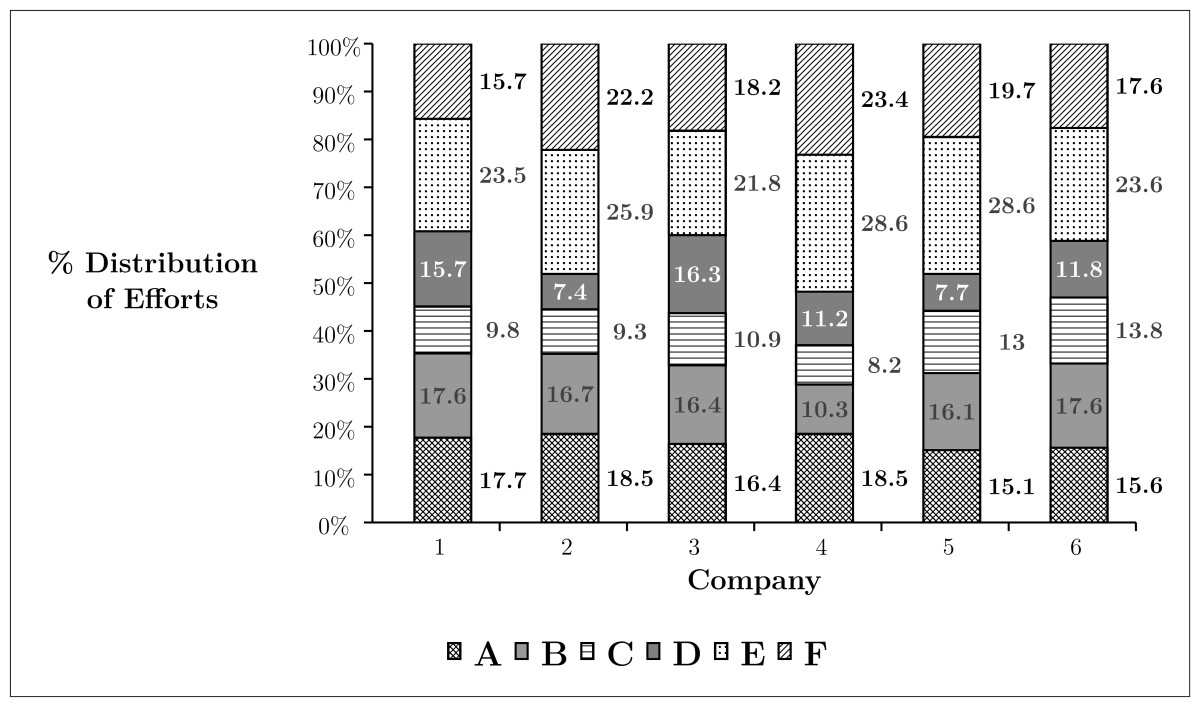
Suppose the companies find that they can remove operations B, C and D and redistribute the effort released equally among the remaining operations. Then, which operation will show the maximum across all companies and all operations?

  1. Operation E in company $1$
  2. Operation E in company $4$
  3. Operation F in company $5$
  4. Operation E in company $5$

1 Answer

Position:
Show:

Related questions

0 0 votes
0 0 answers
1.5k
1.5k views
go_editor asked Apr 24, 2016
1,497 views
Figure $1$ shows the amount of work distribution, in man-hours, for a software between offshore and onsite activities. Figure $2$ shows the estimated and actual work effo...
0 0 votes
0 0 answers
1.6k
1.6k views
go_editor asked Apr 24, 2016
1,553 views
Figure $1$ shows the amount of work distribution, in man-hours, for a software between offshore and onsite activities. Figure $2$ shows the estimated and actual work effo...
0 0 votes
0 0 answers
1.5k
1.5k views
go_editor asked Apr 24, 2016
1,456 views
Figure $1$ shows the amount of work distribution, in man-hours, for a software between offshore and onsite activities. Figure $2$ shows the estimated and actual work effo...
0 0 votes
0 0 answers
1.2k
1.2k views
go_editor asked Apr 24, 2016
1,249 views
Figure $1$ shows the amount of work distribution, in man-hours, for a software between offshore and onsite activities. Figure $2$ shows the estimated and actual work effo...
0 0 votes
1 1 answer
1.8k
1.8k views
go_editor asked Apr 24, 2016
1,753 views
Figure $1$ shows the amount of work distribution, in man-hours, for a software between offshore and onsite activities. Figure $2$ shows the estimated and actual work effo...