edited by
505 views
0 0 votes

The two plots below give the following information about six firms $\text{A, B, C, D, E}$, and $\text{F}$ for $2019$ and $2023$.

PAT: The firm's profits after taxes in Rs. crores,
ES: The firm's employee strength, that is the number of employees in the firm, and
PRD: The percentage of the firm's PAT that they spend on Research and Development (R$\&$D).

In the plots, the horizontal and vertical coordinates of point representing each firm gives their ES and PAT values respectively. The PRD values of each firm are proportional to the areas around the points representing each firm. The areas are comparable between the two plots, i.e., equal areas in the two plots represent the same PRD values for the two years.
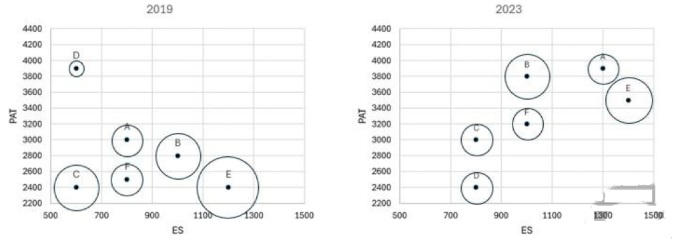
Which among the firms $\text{C, D, E}$, and $\text{F}$ had the least amount of $\text{R}$$\&$$\text{D}$ spending per employee in $2023?$

  1. Firm $\text{D}$
  2. Firm $\text{F}$
  3. Firm $\text{E}$
  4. Firm $\text{C}$

Please log in or register to answer this question.

Position:
Show:

Related questions

0 0 votes
0 0 answers
531
531 views
Shubham Sharma 2 asked Jun 26, 2025
531 views
The above is a schematic diagram of walkways (indicated by all the straight-lines) and lakes ($3$ of them, each in the shape of rectangles - shaded in the diagram) of a g...
0 0 votes
0 0 answers
557
557 views
Shubham Sharma 2 asked Jun 26, 2025
557 views
 The above is a schematic diagram of walkways (indicated by all the straight-lines) and lakes ($3$ of them, each in the shape of rectangles - shaded in the diagram) of a ...
0 0 votes
0 0 answers
645
645 views
Shubham Sharma 2 asked Jun 26, 2025
645 views
The above is a schematic diagram of walkways (indicated by all the straight-lines) and lakes ($3$ of them, each in the shape of rectangles - shaded in the diagram) of a g...
0 0 votes
0 0 answers
558
558 views
Shubham Sharma 2 asked Jun 26, 2025
558 views
The above is a schematic diagram of walkways (indicated by all the straight-lines) and lakes ($3$ of them, each in the shape of rectangles - shaded in the diagram) of a g...
0 0 votes
0 0 answers
525
525 views
Shubham Sharma 2 asked Jun 26, 2025
525 views
The numbers $1,2,3,4,5,6,7,8,9$, and $10$ are placed in ten slots of the following grid based on the conditions below.Numbers in any row appear in an increasing order fro...