recategorized by
438 views
0 votes
0 votes

The following table gives the tariff (in paise per kilo-watt-hour) levied by the UPSEB in $1994–95$, in the four sectors and the regions within them. The table also gives the percentage change in the tariff as compared to $1991–92$.

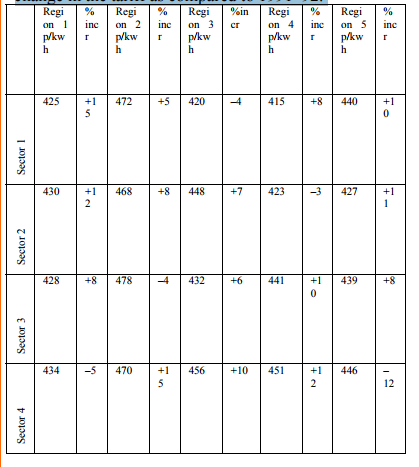
The UPSEB supplies power under four categories, Urban ($25$%), Domestic ($20$%) Industrial ($40$%) and Rural ($15$%). In $1994–95$, the total power produced by the UPSEB was $7875$ Megawatts.

Which of the following is true?

  1. The average tariff in Region $4$ is $437.5$ p/khw.
  2. The average tariff in Region $2$ is greater than the average tariff in Region 5.
  3. In $1991-92$, the industrial sector contributed to about 42% of the total revenue from power.
  4. None of these
recategorized by

Please log in or register to answer this question.

Related questions

0 votes
0 votes
0 answers
1
0 votes
0 votes
0 answers
2
0 votes
0 votes
0 answers
3
makhdoom ghaya asked Jun 15, 2017
478 views
The questions are based on the following information.What is the simple annual rate of increase in the number of Agricultural loans from $1970$ to $1983$?$132$%$81$%$75$%...
0 votes
0 votes
0 answers
4
makhdoom ghaya asked Jun 15, 2017
449 views
The questions are based on the following information.In which year was the number of loans per rural bank the least?$1974$$1971$$1970$ $1975$
0 votes
0 votes
0 answers
5
makhdoom ghaya asked Jun 15, 2017
543 views
The questions are based on the following information.What is the value of Agricultural loans in 1983 at 1970 prices?326531753085None of these