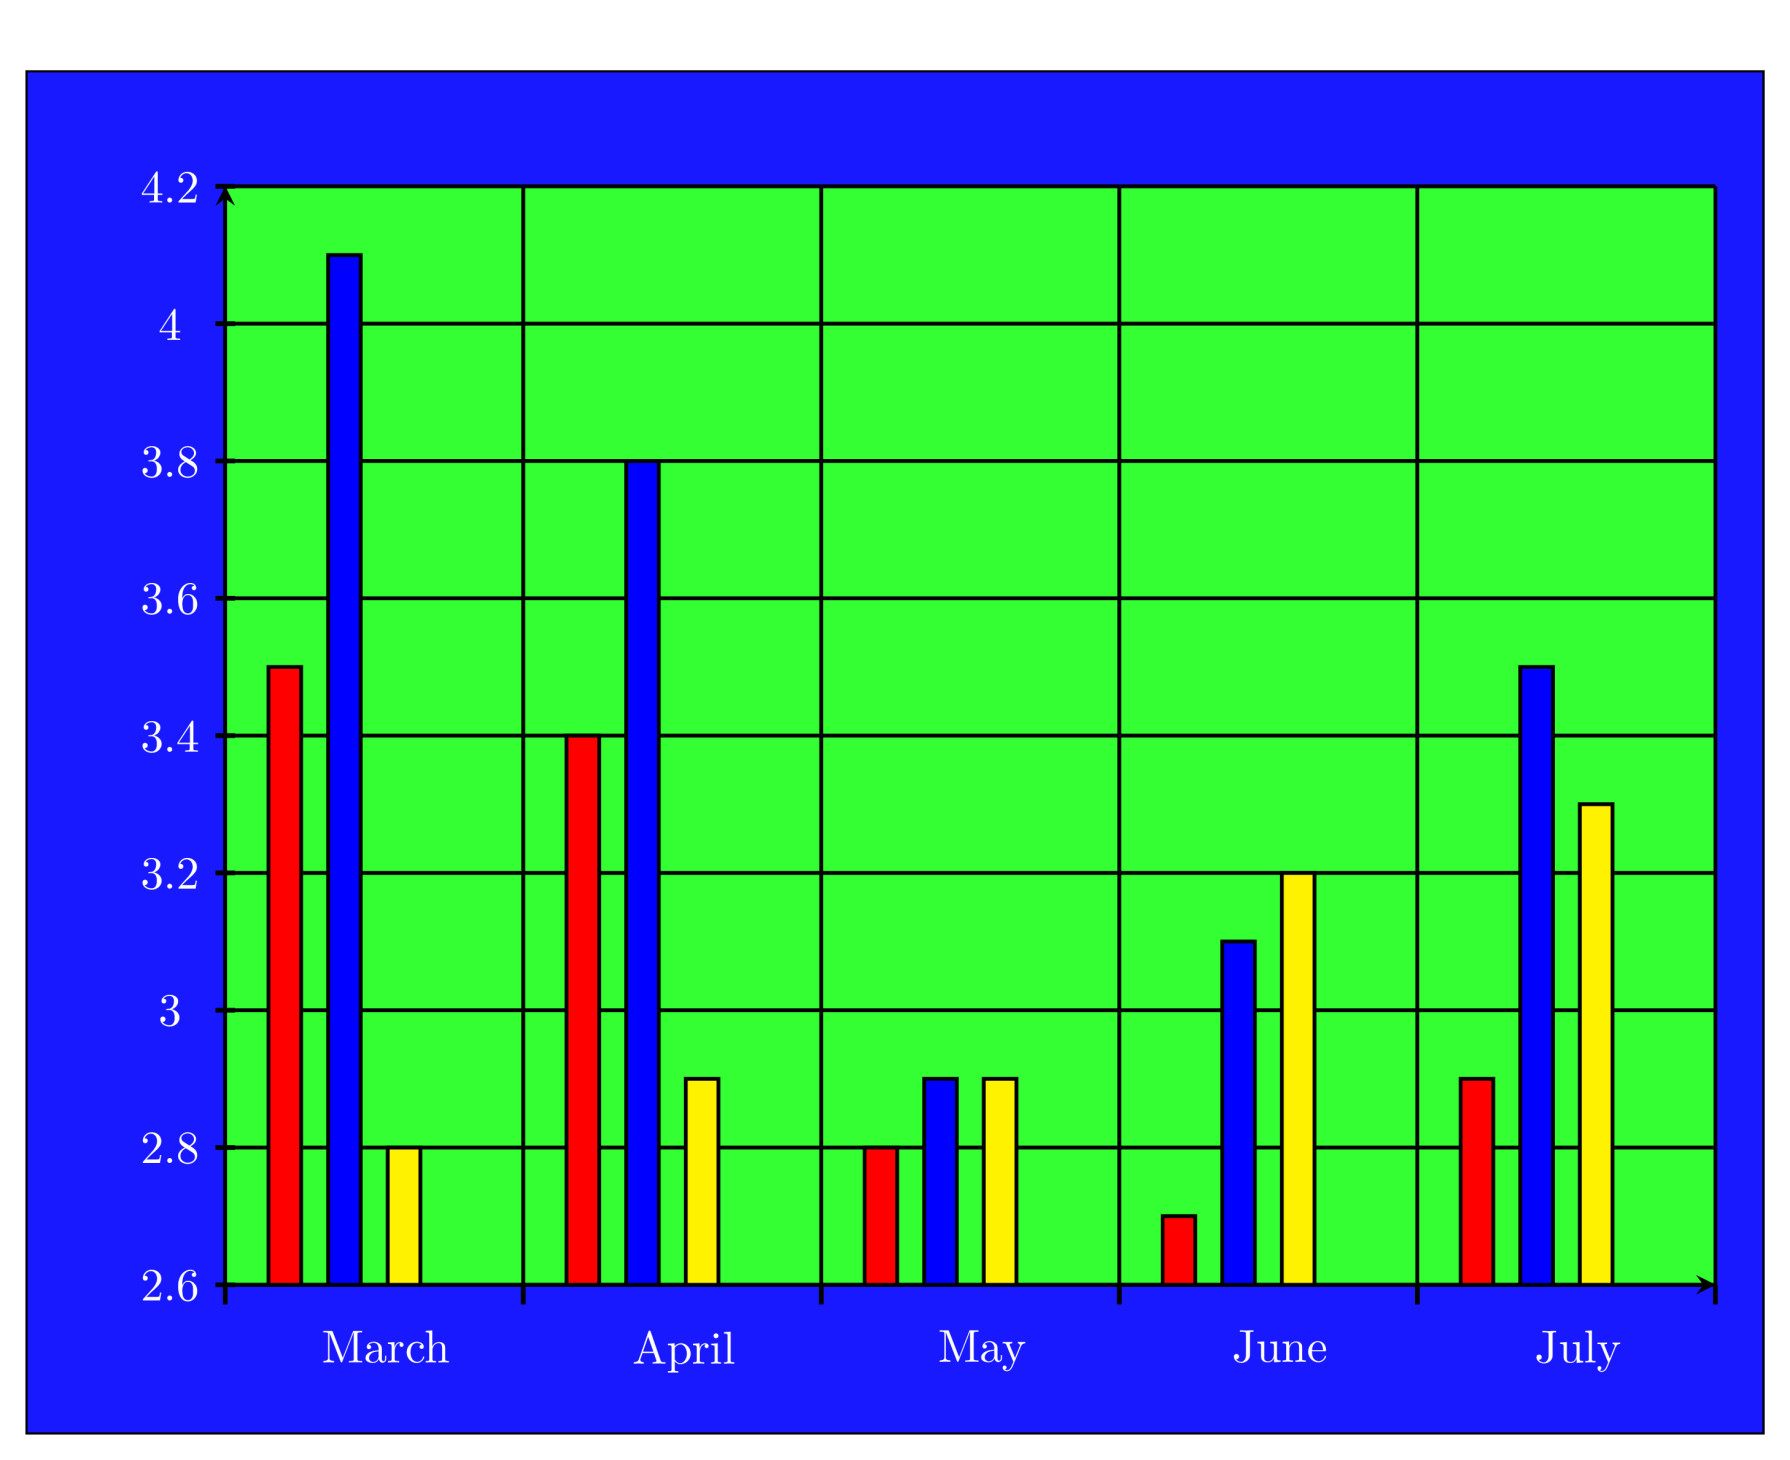
The graph above gives the number of computers sold each month (in thousands) by three different computer Manufacturer $1$ (in red), Manufacturer $2$ (in blue) and Manufacturer $3$ (in yellow).
Which month showed the largest total decrease in PC sales over the previous month?
- March
- April
- May
- June
- July
What percentage of manufacturer 2' s sales were made in April ( to the nearest percent)
- 16
- 22
- 27
- 33
- 38
If the average profit made on each PC sold by manufacturer 3 over all 5 months was 78 pounds what was the total profit in pounds on all sales in this period by that manufacturer?
- 650,400
- 820,700
- 980,300
- 1,095,600
- 1,177,800